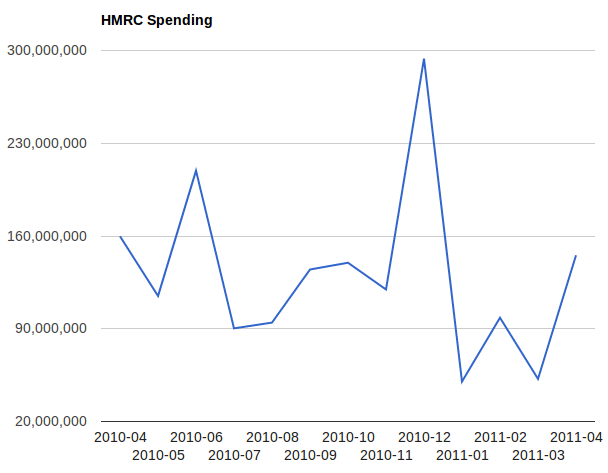
HMRC monthly spending graph
Developed by:
Tim Retout
Graph of HMRC spending data over time, grouped by month. The data is scraped from the CSV files using Scraperwiki, cleaned up by Google Refine, and visualized using Google Charts. Updates once a month.
Uses dataset:
Apps submitted to data.gov.uk are currently approved for publication on the general level of their context and appropriateness.
Whilst we review these on a periodical basis, we do not own responsibility for the regular update and maintenance of these apps. Any queries about individual apps or tools published need to be directed to the originator.